

OfferBoard CEO and CFIFA Chair Chris Tyrrell presented detailed research in his paper “Equity Crowdfunding 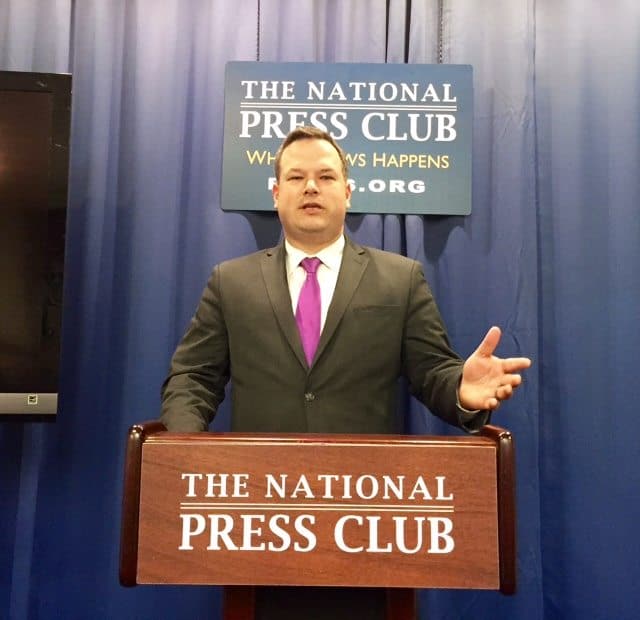 Under Title II of the JOBS ACT: The First Year” at the Washington, D.C. Growth Summit Update. Tyrrell founded OfferBoard, an investment platform that uses technology, big data and dating-style matching algorithms to help CEOs of growing companies raise capital and match investors with companies that interest them. OfferBoard’s proprietary, patent-pending systems leverage the technology and data of the Australian Small Scale Offerings Board, the world’s oldest small equities funding platform. As a global advocate of crowdfunding and services as a chairman of CrowdFund Intermediary Regulatory Advocates (CFIRA), the leading advocacy organization for the securities crowdfunding industry in the U.S., Tyrrell is also a non-executive board member of the Australian Small Scale Offerings Board and was also a delegate to the Third Global Entrepreneurship Summit.
According to the Abstract from “Equity Crowdfunding Under Title II of the JOBS ACT: The First Year,” Tyrrell reports “information extracted from Form D filings submitted to the U.S. Securities and Exchange Commission for sales of securities occurring between September 23, 2013 and September 22, 2014. This is the first full year of private placement data since Title II of the JOBS Act was made effective. The purpose of this report is to analyze the data and attempt to describe the impact of the implementation of Title II of the JOBS Act on the private placement market as a whole. Our key observations include a 50% increase in the number of accredited investors participating in private placements over the previous year and an increase in the number of companies making filings with respect to such placements of 24% over the historic three-year average.”

In the subject data, OfferBoard found the following over the one year period examined:
- 23,564 Regulation D filings were submitted; 12.6% were amended filings. This is 24% higher than the historical average.
- $1 trillion in securities were offered and $690 billion were sold.
- This is slightly lower than the historical average of $846.5 billion sold from 2009-2012.
- The median offering size was $1.2 million, which is smaller than the historical median of $1.5 million from 2009-2012.
- 67% of capital sought was reported raised at the time of filing.
- This represents a slight (4%) increase over historical averages from 2009-2012.
- Among 506(c) generally solicited offerings, only 16% of the capital sought had been raised at the time of filing. Filing is required within 15 days of first receipt of capital or irrevocable commitment of capital.
- Possible explanations for this difference include earlier filing of Form D by 506(c) offerors and slower capital formation under 506(c).
- The number of investors reported in the offerings increased 50% over historical averages – 352,772 investors in the subject year compared to 234,000 in 2012.
- One possible explanation for this difference is that the effectiveness of Title II has increased the total number of investors investing in private placements.
- The percentage of offerings with non-accredited investors has decreased slightly from 10% of offerings in 2012 to just under 7% in the past 12 months. This is a likely outcome of the prohibition on non-accredited investors in 506(c) offerings.
- 12% of the subject offerings reported using an intermediary, unchanged from 2009-2012 reported averages.
OfferBoard introduces the report:
“Change in the marketplace was promised (and feared) as a result of the JOBS Act. As of today, the impact
has not been as radical as many had predicted. Investor access to private placements has increased, but only incrementally. Average minimum investments have come down, and the amount of investment sought has decreased as well, but the overall impact of the changes has been relatively modest.
“There is room for cautious optimism about the use of 506(c) offerings and the companies that use them – whether on or off private placement platforms – as the market continues to respond and adapt to this new method of raising capital. The data underlying these claims, and the potential conclusions that can be drawn from it, follow.”

Data is categorized into the following talk points: The Size of the Regulations D Market, Prevalence of Generally Solicited Offerings in the Market, Distinctions of Companies Using 506(c) General Solicitation, Industry Differentiation and Geographic Distinctions.
Per the firm’s request, only OfferBoard’s abridged findings and tables are cited below. For more details, please contact OfferBoard:
THE REGULATION D MARKET
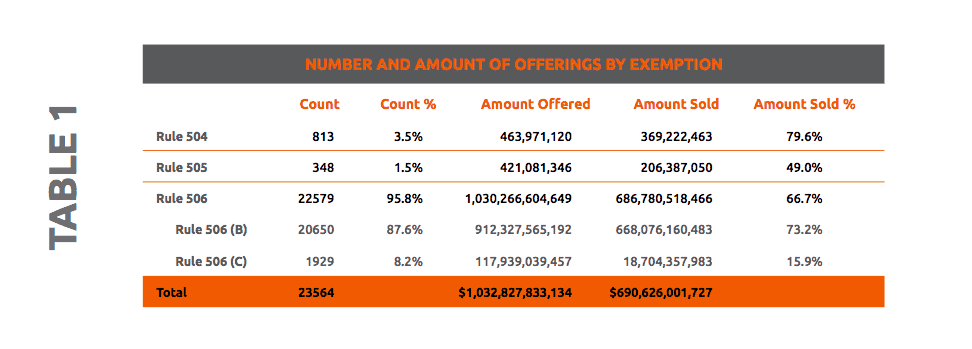
“Capital raised through unregistered offerings during the subject period continues to represent a large segment of the overall capital market. Over the past twelve months, $690 billion in Regulation D exempt securities have been reported as sold. This is lower than the historic annual totals for 2010-2012, but higher than 2009,” stated OfferBoard. “Thus, Title II has not yet had the predicted effect of significantly increasing the overall size of the private capital markets.”
PREVALENCE OF GENERALLY SOLICITED OFFERINGS IN THE MARKET
“Generally solicited 506(c) offerings are still only a small portion of the market, representing only 8.5% of all 506 offerings. Since the enactment of Title II of the JOBS Act, 1,929 issuers have reported using the 506(c) exemption for a total of $118 billion in offerings, of which $18 billion was sold by the time of filing,” shared OfferBoard.
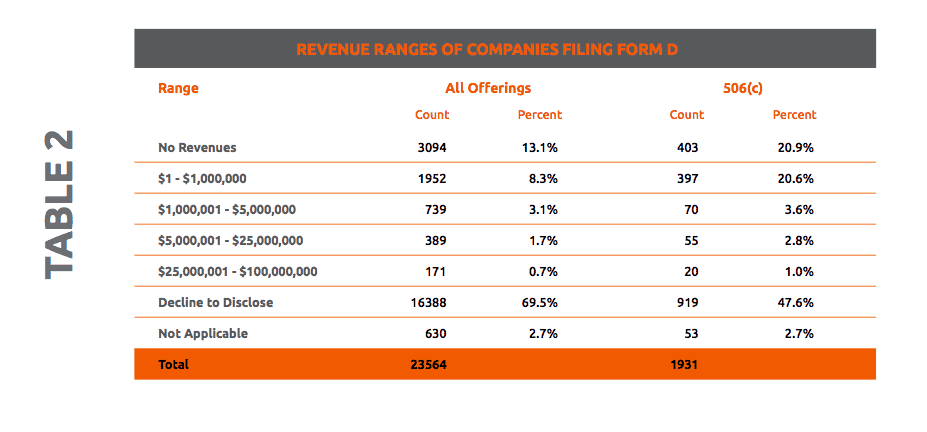
DISTINCTIONS OF COMPANIES USING 506(C) GENERAL SOLICITATION
Findings include: “The companies using Rule 506(c) more frequently disclose the amount of revenue that they are making than companies using other exempt offerings – 48% as opposed to 70%. This may be due in part to the public nature of the offerings, in which the companies are making a greater amount of information available to the public for general solicitation than they do under other offerings….It is also interesting to note that, on average, there are more investors in any given Reg D offering than there are in 506(c) offerings. This may in part be due to the fact that 506(c) offerings on the whole have a lower percentage of funds committed at the time of filing.”
INDUSTRY DIFFERENTIATION
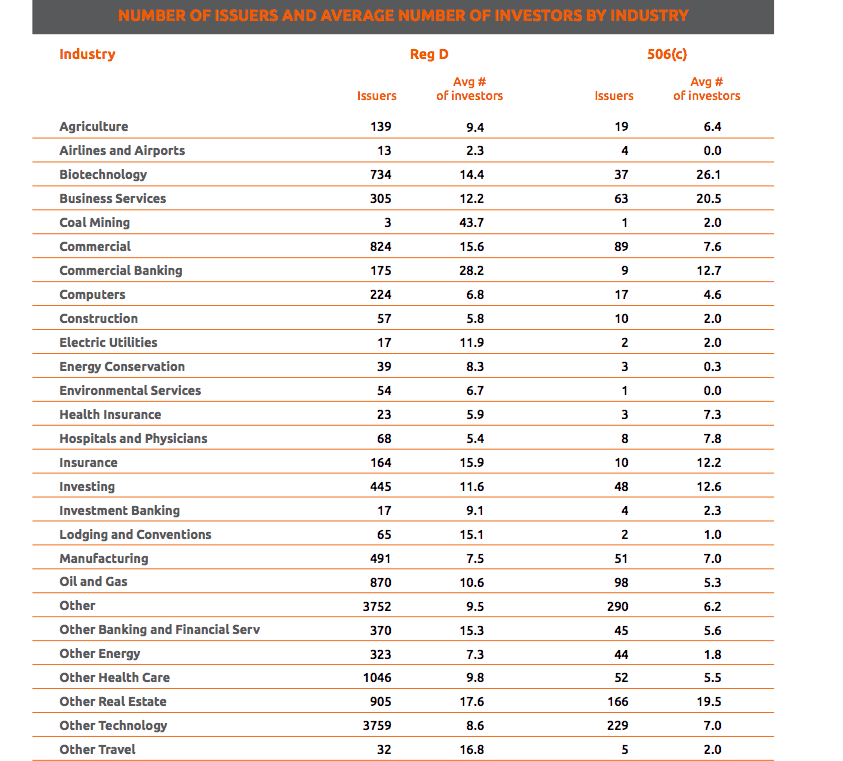
“The average number of investors per deal varies widely by industry, and certain industries seem to be increasing the number of investors as a result of the 506(c) exemption,” found OfferBoard, “This may in part be due to the fact that certain industries are being better served by platforms or intermediaries than others, or that – due to market conditions – certain industries are currently more desireable to investors than others.”
GEOGRAPHIC DISTINCTIONS
“The top 5 states with the most 506(c) offerings by count (in order) were: California, Texas, New York, Florida, and Illinois,” indicated OfferBoard. “This is largely reflective of the market as a whole, with the exception that Massachusetts replaced Florida in the top five, and Texas and New York were switched. Pennsylvania sold the most 506(c) offerings on a cash basis, while New York remains the leader across all Regulation D Offerings.”
TYPE OF SECURITIES OFFERED
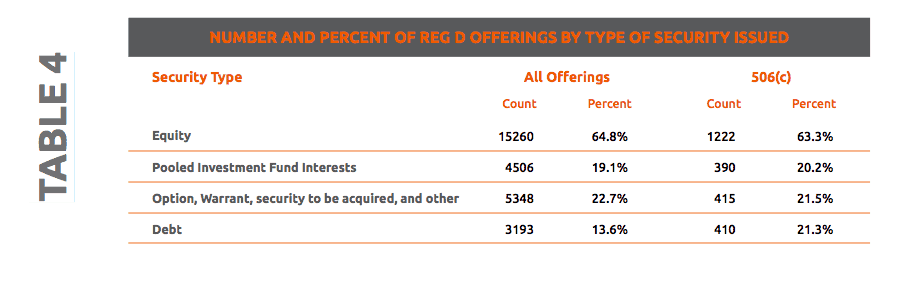
“Among all Regulation D offerings, 65% are equity offerings, which is consistent with historical averages. 506(c) offerings seem to be consistent with historical ratios, except in the case of debt where the 506(c) debt offerings are 7% more prevalent than the total market,” revealed OfferBoard. “This may in part be due to the prevalence of convertible notes as an instrument among 506(c) offerings, though it is difficult to say definitively as the Form D filings do not capture that security type specifically.”
CONCLUSIONS
“The advent of the 506(c) publically advertised private placement has gradually begun to have several significant effects on the overall private placement market. The number of accredited investors investing in private placements has increased, as has the number of offerings, yet the overall volume of capital raised is mostly unchanged compared to historic averages. The ratio of accredited to unaccredited investors has slightly declined. The use of intermediaries remains in line with historic averages. At this stage, Title II of the JOBS ACT has not significantly disrupted the markets or revolutionized capital raising in the U.S., yet it has increased access for both investors and emerging growth companies,” reported OfferBoard.