


EY recently published its annual Fintech Adoption Index ranking 27 different countries on their willingness to part with traditional financial services and migrate to the new, shiny of digital financial services. Or, perhaps, Fintech services have simply filled a void providing a service where previously one did not exist.
The researchers at EY state:
“Adoption of Fintech services has moved steadily upward, from 16% in 2015, the year our first Fintech Adoption Index was published, to 33% in 2017, to 64% in 2019. Awareness of Fintech, even among non-adopters, is now very high. Worldwide, for example, 96% of consumers know of at least one alternative Fintech service available to help them transfer money and make payments.”
As smartphones and internet access have become increasingly ubiquitous, digital financial services are soon to appear.
This year EY explains, the Index includes traditional financial services providers that provide digital offerings instead of the group of emerging challengers seeking to oust (or partner with) established financial services firms. This inclusion is due to the rise of established firms launching viable offerings to stave off Fintechs. Competition is a good thing for consumers and businesses.
EY believes there are two types of Fintech services. Disrupted and invented. The disruptors challenge existing services with a digital service. Invented are new services launching where one did not exist before. Think mobile phone payments or peer to peer lending.
Regardless of semantics, it is clear that the acceptance of Fintech is growing globally. And old finance shouldn’t fight the tape.
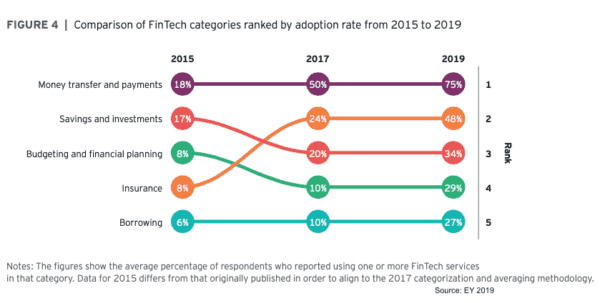
EY categorizes Fintech services into five different areas; money transfer and payments, budgeting and financial planning, savings and investment, borrowing and insurance. The survey was based on questions of both awareness and utilization. Consumer awareness is said to be high across all categories but payments and transfers have the highest followed by Insurance (or Insurtech) – which has risen in prominence since 2015.
Overall, emerging markets are leading the way with China topping the list, followed by Indian and then Russia.
The UK, a leading Fintech hub, is middle of the pack, interestingly enough. Most likely this has to do with consumer inertia. Existing services may be deemed good enough or the process of migration takes too much effort. But over time this will change.
Japan is at the bottom of the list just edging out France for last place.
Perhaps, the biggest disappointment is the US which is in the bottom four. A highly fragmented market and an antiquated regulatory approach (50 different states and umpteen different federal regulators) doesn’t help. But this will inevitably change as well. It will just take some time.
EY Fintech Adoption Index by Country
- 87% China
- 87% India
- 82% Russia
- 82% South Africa
- 76% Colombia
- 75% Peru
- 73% Netherlands
- 72% Mexico
- 71% Ireland
- 71% UK
- 67% Argentina
- 67% Hong Kong*
- 67% Singapore
- 67% South Korea
- 66% Chile
- 64% Brazil
- 64% Germany
- 64% Sweden
- 64% Switzerland
- 58% Australia
- 56% Spain
- 51% Italy
- 50% Canada
- 46% USA
- 42% Belgium & Luxembourg
- 35% France
- 34% Japan
It is a good report. You may download the EY Fintech Adoption Index here.