
 Below is an infographic created in conjunction with London Fintech Week which commences next Monday (July 18). The research compiled on Fintech growth is quite interesting showing a dramatic increase in the Asia Pacific region and slowing growth in the UK. China has overtaken Europe, the UK and USA South & East, in overall investment. According to the information provided:
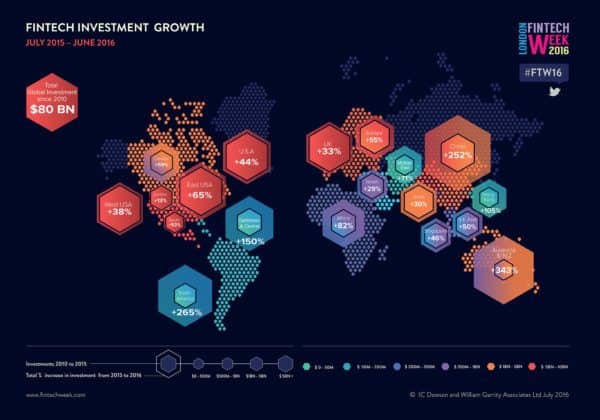
- From July 2015 to June 2016, Fintech investment surged in China growing to $8.8 billion, increasing 252% since 2010
- Total global Fintech investment stands at $80 billion since 2010
- Australia and New Zealand have seen a 343% jump in investment, moving from a total of $300 million between 2010 and 2015 to $1.36 billion in the last year alone.
- The UK is ahead of Continental Europe at $7.2 billion versus $6.8 billion but grew at a slower pace during the last year at 33% versus 55%
- Investment by category in year to June 2016, show payments and peer to peer lending (P2P) and direct lending are the biggest area of investments at $5.3 billion each (66% of total investment). Breaking down lending into its constituent parts direct lending is $3.3 billion (21%) and ‘Peer-to-peer lending’ $2 billion (12.3%)
- Loans in total have seen a decrease in investment compared to 2015 from $8 billion down to $3.3 billion first half 2016 a yearly run rate of around $6.6 billion. This is as a result of institutional investors being more cautious in placing funds on to direct lending and P2P platforms in 2016
Click on Image to Enlarge