


It’s been over a year since the SEC’s Division of Economic and Risk Analysis (DERA) published its report on Private Securities Offerings post-JOBS Act. And while since that time, DERA has published more data about Regulation CF and Regulation A, the SEC has yet to offer any new data or analysis on Regulation D.
I was curious as to how Regulation D (Reg D) numbers may have changed since DERA’s report was published, so I figured I’d gather some data about Reg D for 2016 to see for myself. Reg D data is publicly available in the form of Form D’s that are filed with the SEC’s EDGAR system by companies who raised money under the exemption. Fortunately for me, there is a website that organizes much of the data in aesthetically pleasing charts and graphs. Unfortunately for me, however, their charts were not easy to filter so much of the data I gathered I compiled the old-fashioned way (entering individual numbers into excel). As such, I make no guarantees as to the accuracy of the figures below. From their charts, I was able to collect the following information about Reg D in 2016:
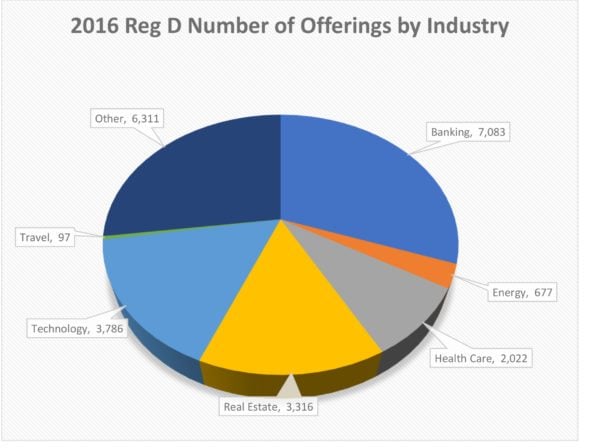
- 2016 saw a total of 23,292 offerings
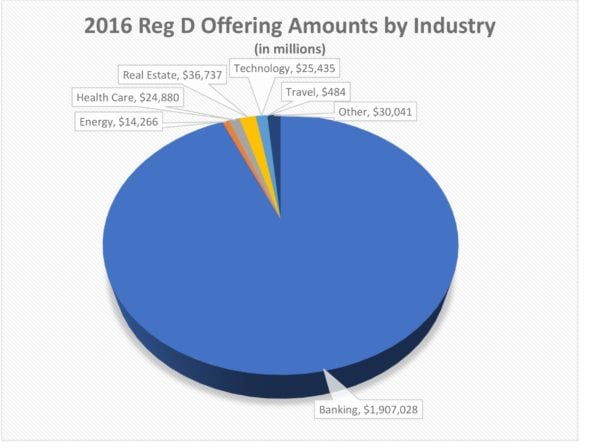
- Over $2.05 Trillion dollars were offered (note: this is only what was offered not what was actually raised; total amount raised may be considerably less; in fact, I found 3 offerings totaling over $1.1 billion dollars that have raised nothing to date, so total amount raised for 2016 may actually be less than $1 Trillion)
- The average offering size was $87.8 Million (again offered not sold)
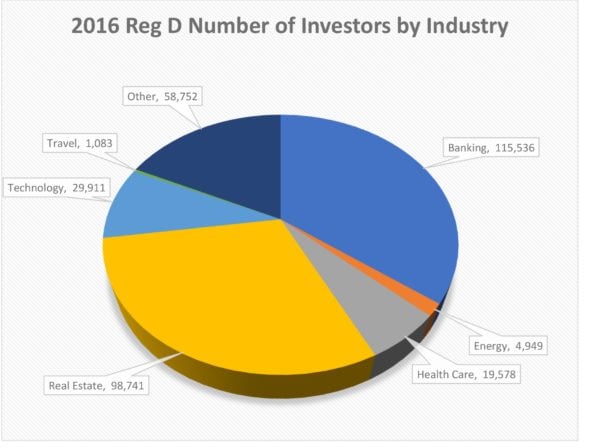
- There were 307,764 total investors
- The average number of investors per offering was 13.2
- The banking industry had the largest total offerings in amount ($1.9 Trillion), number of offerings (7,083), and number of investors (115,536)
- The travel industry had the smallest total offerings in amount ($484.2 Million), number of offerings (97), and investors (1,083)
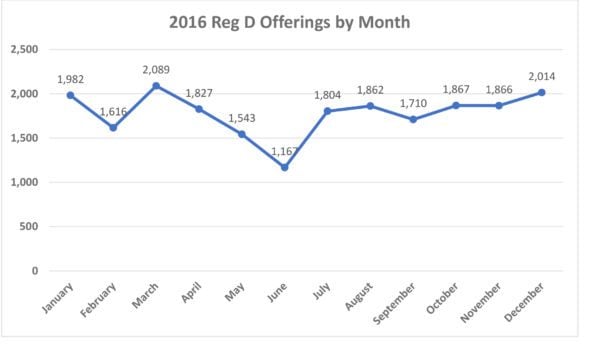
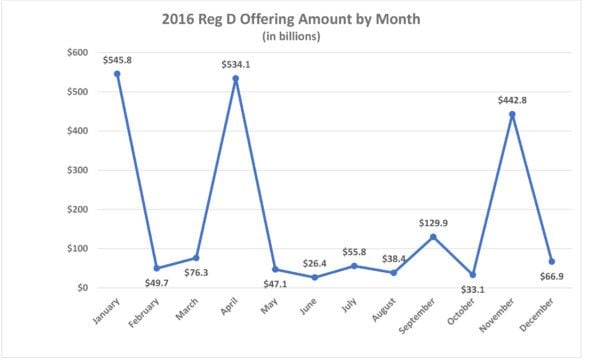
- While January saw the largest total offerings both in amount ($545.8 Billion) and investors (39,879), March was actually the busiest month with the most offerings (2,089)
- June was the slowest month and saw the smallest total offerings in amount ($26.4 Billion), number of offerings (1,167), and investors (14,680)
Finally, here are some graphs I made to illustrate the data gathered:
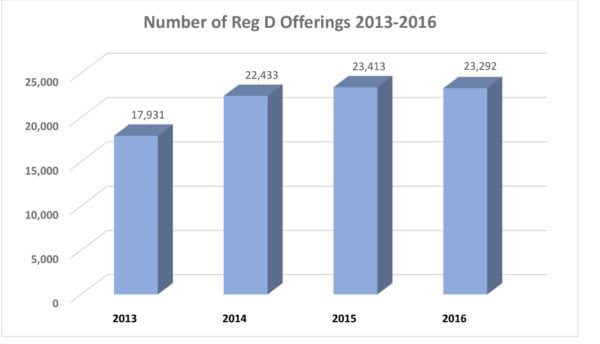
It’s difficult to draw any conclusions from the data as compared to the information provided by DERA’s report from last year. The total number of offerings from 2015 to 2016 went down slightly, but just barely (23,413 compared to 23,292). Also, given my estimate that the actual amount raised in 2016 was less than $1 Trillion, it looks like the total amount raised decreased compared to 2015 as well (according to DERA’s report on page 4, there was over $1.2 Trillion raised under Reg D in 2015). Again, the data I gathered may not be completely accurate so whatever conclusions you want to draw are your own.
Have a crowdfunding offering you'd like to share? Submit an offering for consideration using our Submit a Tip form and we may share it on our site!