

For those of you who are hard core peer to peer lending followers this is for you. US industry leader has updated their statistics page offering up a more dynamic interface to track loans flowing through their platform. As Lending Club describes it:
Updated interactive design see new ways to filter, sort and view the data:
- Sort the “Average Interest Rate” by grade and by 36- and 60-month terms.
- Check out the “Grade Mix Over Time” graph and cut the data across 36- and 60-month terms.
- View the “Loan Performance Details” across different units (dollar amount, number of loans, % of issued loans).
Review new information:
- See the “Net Annualized Return by Vintage” chart – new data that we haven’t showcased before that shows net annualized return by the year in which the loans were issued
- Do you see a chart or graph that you don’t understand? Click on “Learn more about this chart” to get a description of what it means.
The information is interesting as you can quickly assess a high level of activity on the funding platform. Try to get this degree of transparency from your local bank.
![]()
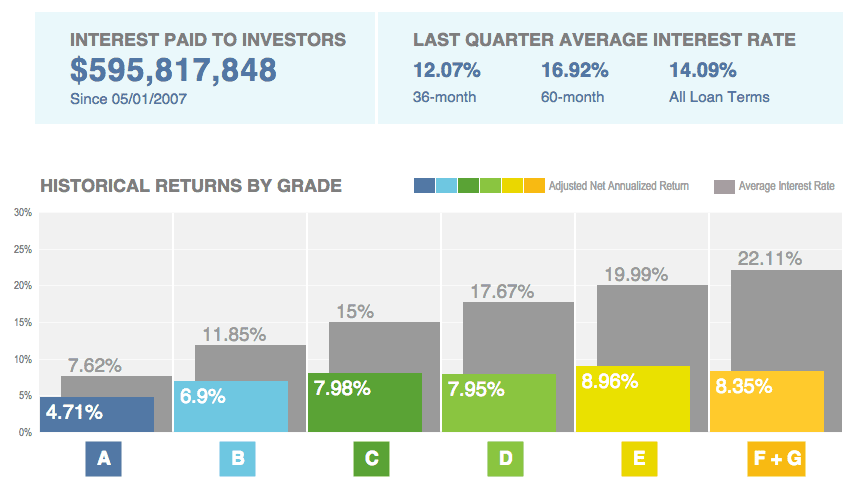
![]() As of the end of September, Lending Club has loaned $6.2 Billion and returned almost $600 million to investors. The highest grade loan on their site generates an estimated net annualized return of 4.71%. Compare that to placing your cash at a bank or in a CD and you will quickly understand why the company is growing so rapidly.
As of the end of September, Lending Club has loaned $6.2 Billion and returned almost $600 million to investors. The highest grade loan on their site generates an estimated net annualized return of 4.71%. Compare that to placing your cash at a bank or in a CD and you will quickly understand why the company is growing so rapidly.