Kevin M. Duvall allowed us to share some charts he has compiled based in part on a list of the top 50 all-time Kickstarter campaigns we compiled back in September.
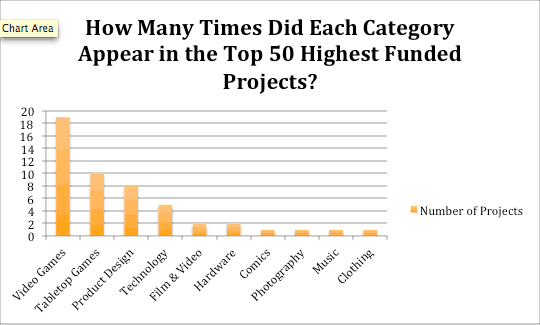
The aim of the data is to show how Kickstarter success stories are dispersed across different categories. In the first chart we can visualize the dominance of Kickstarter’s most popular categories. The top four categories are video games, tabletop games, product design and technology. They account for 42 of the top 50 campaigns listed in our article.

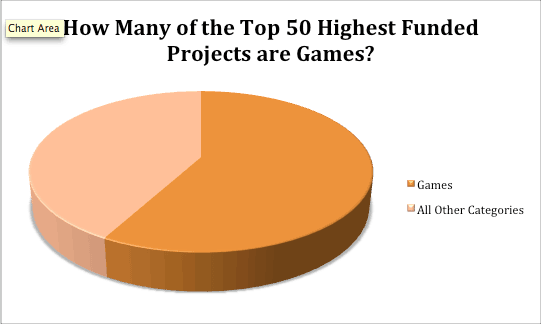
Here we get an idea of how many of these projects are in the two gaming categories: video games and tabletop games. Games account for 58% of the top 50 campaigns we compiled earlier this year.

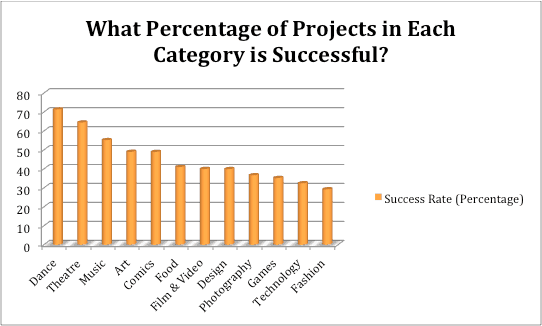
Finally, we have a visualization of aggregate success rates by category on Kickstarter. This was the basis of an article in SFGate earlier this year that pointed out that (somewhat counterintuitively) dance projects have the highest success rates on Kickstarter. About 70% of campaigns in this category are successful. Despite game-related projects taking the lion’s share of the big Kickstarter raises, they’re funded at a rate of less than 40%.

As for the why behind these rates of success, Duvall makes an astute point…
Again, cost is certainly a factor. The average successful dance project raises about $4,300, which is the smallest average of all the categories. Unsurprisingly, the category with the highest average is technology, which averages around $75,000.

