After our show stopping success last year in using data on borrowers to predict the Super Bowl winner, we decided to for a second year of success, even if the Patriots did not. Using the loan data from Lending Club over 2010-2015, we compared borrowers in Colorado to those in North and South Carolina on loan volume, borrower financial quality, loan characteristics and performance of loans from 2012. And unlike the grounds crew at Levi’s Stadium, we did indeed remember both teams. Once again, let the games begin!
 First Quarter: Loan Volume 2010 – 2015
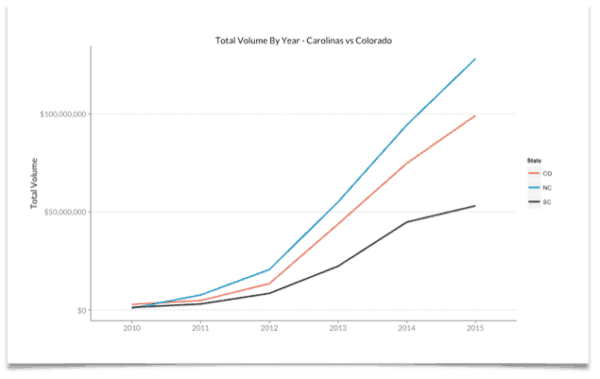
The population of North and South Carolina combined, at 14.77 million was just under 3 times that of Colorado’s 2014 population of 5.36 million. In terms of loan volume, however, Colorado had about half the annual volume of the Carolinas. Colorado’s population is only about 10% higher than South Carolina’s, but their loan volume was close to 75% higher.
ADVANTAGE: COLORADO
Second Quarter: 2015 Vintage Loan Borrower Characteristics
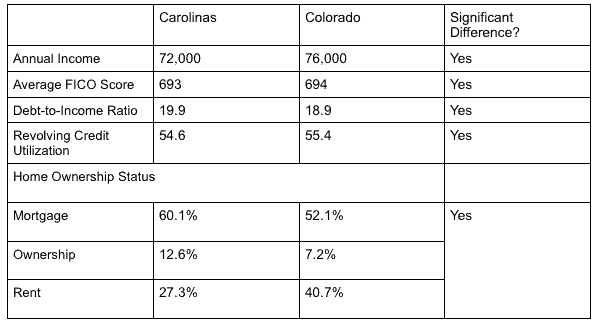
Once again, we had interesting differences in the borrower financial characteristics in 2015. As we can see in the table below, borrowers in Colorado have higher average annual income and FICO score with a lower debt to income ratio, but they also have a higher rate of utilization of their revolving credit lines. There is a much higher rate of outright home ownership and of home mortgages in the Carolina’s while borrowers in Colorado are much more likely to be renting.
The significance of the differences of the home ownership was found using Pearson’s Chi-Square test which compares the distributions of counts for categorical data. For the other variables, Welch Two Sample t-tests were used to determine if two data sets have the same mean, using a p-value of 0.1 as the test for significance.
ADVANTAGE: TIE
Third Quarter: 2015 Vintage Loan Characteristics
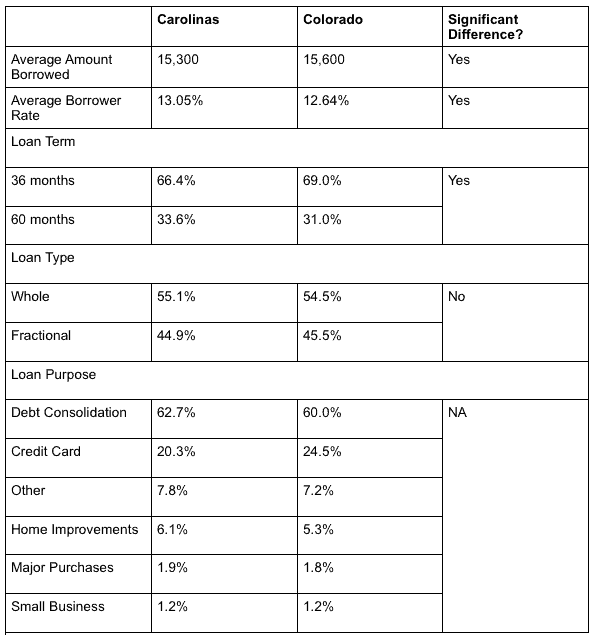
Loans to borrowers in Colorado were $300 higher with 0.40% lower interest rates than those in the Carolinas in 2015. A higher percentage were 36-month loans in Colorado, although borrowers had similar distributions of loan type and purpose.
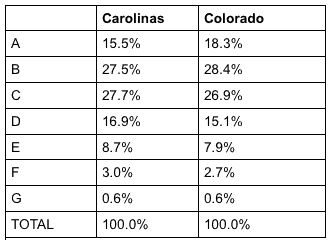
The distribution of grades shown below highlights a larger percentage of A and B grade loans in Colorado than the Carolinas. We see a larger percentage of middle range C, D and E grade loans in the Carolinas, explaining the higher interest rate there than in Colorado.
ADVANTAGE: TIE
Fourth Quarter: 2012 Loan Performance
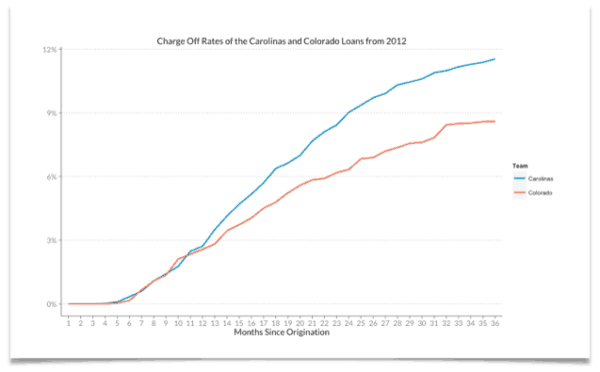
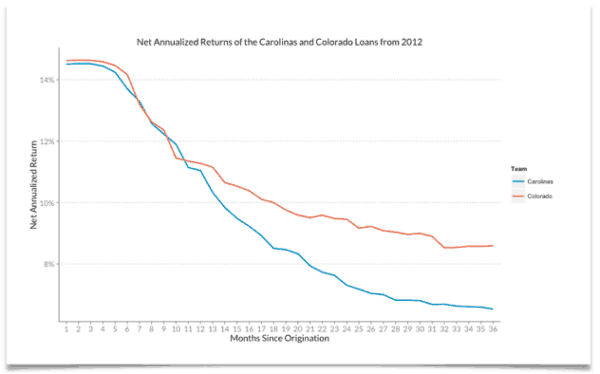
At this point in the match-up, Colorado has a slight advantage over the Carolinas, but like the fourth quarter of Sunday’s game, performance (in the fourth quarter) is the most important. In this match-up, we see clearly that 2012 vintage borrowers in Colorado perform better than those in the Carolinas after 36 months of loan payment.
In the 2012 vintage loans that we used for comparison, borrowers in Colorado had slightly higher interest rates with significantly higher prepayment rates and lower charge-off rates. The result was a more than 2% difference in the Net Annualized Return.
WINNER: COLORADO
We will have to see if this result holds true on Sunday also. Best of luck to both teams and their 12th men!
 Catherine Pargeter is Analytics Manager at Orchard Platform. She focuses on client risk models and analytics at Orchard. Previously Catherine worked as a quantitative and equity research analyst for a socially responsible investment firm. She also spent time in southern Malawi as a Peace Corps Volunteer. Catherine has a Masters in Environmental Science and Management, specializing in Corporate Environment Management and Pollution Remediation Modeling from UC Santa Barbara. She received her Bachelors from the University of Michigan with a degree in Industrial and Operations Engineering.


